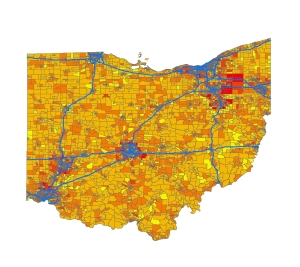
In this lab I relearned the basics of ARC GIS.
We made file connections along with pulling specific data layers out of the larger data files.
We looked at attribute tables and saw what kind of data we can create maps off of in the table. Some of these attributes in a data layer can be pollution (blue) and number of house holds ( orange) in each census block in the census block data layer.
The red and blue lines you see on both of these maps above are the interstate highway system. We pulled it out of the roads and highway data layer. I did so by selecting just the interstate highways and then making the Interstates into there own layer. I then just applied this new layer to the maps.
Another fun thing we played around with was the type of projection you make can have. Map projections are a way to represent the 3-D world on a 2-D surface like a map. These projections can make the world map look like stars, cubes, along with other shapes. I also put the latitude and longitude coordinate system onto the world map.
Some interesting things I explored were the arc toolbox and I looked through the water based tools. You can do things that deal with surface water along with some ground water equations. Theses tools are what i found on the wed a long time ago and said would be fun to use but i never found them in our Arc GIS program till now.
Some terms form the lab that we are to define:
Map Document (.mxd files)– they are just files used by arc gis to save the changes you have made to the data layer with out changing the data layer itself. They are just files that save the modifications to the data layer and can not be opened outside of arc gis.
Table of Contents– It is where your data layers are and you can turn the data layers and data frames on and off to show different aspects of your map.
Data Frame—- a data frame holds different map/data layers in the table of contents and can be turned on and off. Only one data frame can be active at a time.
Map Layer— a map layer is a single component of a map and together map layers map out the different aspects of your maps.
Attribute table— an attribute table is with in the map layer and holds in a tabular form all the data in that specific map layer. It can be numerical data like populations or type data like names.


